
Part 1 · Your first project
We'll plan a kitchen renovation: a few tasks in two phases, a milestone at the end, two people and a crew. Every step works the same on macOS and Windows.
1. Start a project
- Choose File › New (⌘N / Ctrl+N). Each project opens in a tab of its own; Window › Next Project (⌘`) moves between them.
- Choose File › Project Information… (also under Project). On the General tab, leave Schedule from: at Project Start Date and type the Start date: of your project.
- The Options tab says how long a day, a week and a month are (Hours per day, Hours per week, Days per month), the Currency symbol, the Date format and the scheduling options. The defaults are 8 hours a day, 40 a week and 20 days a month.
Want something to explore first? File › New from Sample (House) opens a finished house-build plan.
2. Type the tasks
The table on the left starts with the Entry columns: Mode, Name, Duration, Start, Finish, Predecessors and Resource Names. Click the Name cell of the first empty row and start typing; Enter or Tab moves on, F2 edits a cell that already has something in it.
Type these names, with a duration for each:
| Name | Duration |
|---|---|
| Plan | (leave empty) |
| Measure the room | 1d |
| Draw the design | 3d |
| Build | (leave empty) |
| Remove old units | 2d |
| Rewire | 3d |
| Fit cabinets | 1w |
| Tile the walls | 2d |
A duration is a number and a unit: 3d, 1w, 4h, 2 wks. A number alone is in days. Add ? for an estimate (3d?). See What you can type for all of it.
Don't type the Start and Finish dates: Keystone works them out. A date typed into Start pins the task with a Start No Earlier Than constraint, the way Microsoft Project does.
Other ways to add rows: Insert › New Task (the Insert key on a Windows keyboard) puts a new task in at the selected row, and Edit › Delete Task (Delete) takes it out. Edit › Fill Down (⌘D) copies the top cell of a selection down.
3. Build the outline
Select Measure the room and Draw the design, then choose Project › Outline › Indent (⌥⇧→ / Alt+Shift+Right). They move under Plan, which becomes a summary task: its bar spans its tasks, and its dates, work and cost add up from them. Indent the four tasks under Build the same way.
- With a task's Name cell selected (not being typed in), Tab and ⇧Tab indent and outdent too.
- Outdent is ⌥⇧←; Move Up and Move Down are ⌥⇧↑ and ⌥⇧↓.
- The triangle by a summary folds it. Project › Outline › Show All Subtasks and Hide Subtasks fold everything at once.
- Format › Project Summary Task shows a row for the whole project at the top, and Format › Outline Number numbers the rows 1, 1.1, 1.2…
4. Add a milestone
Add one more task at the bottom, outdented to the top level: Kitchen ready, with a duration of 0. A task of no length is a milestone, drawn as a diamond. Insert › Milestone adds one directly.
To give it a date it must not miss, open Project › Task Information… (⇧F2, or double-click the row or bar), go to Advanced and type a Deadline:. The deadline is marked on the chart, and the task is flagged if it finishes after it. The same tab sets a Constraint type: and Constraint date:.
5. Link the tasks
Links say what waits for what. There are three ways to make them.
In the Predecessors column
Type the row number of the task that must come first. For Draw the design, type 2 (Measure the room is row 2). For Remove old units type 3, for Rewire 5, for Fit cabinets 6, and for Kitchen ready 7,8 (it waits for both).
For a link of another kind, or with a lag, add them after the number. Tiling can start two days after the cabinets start, so for Tile the walls type 7SS+2d. Several links are parted by commas: 3,5FS+2 days,7SS.
| Kind | Means |
|---|---|
FS finish-to-start | The task starts when the other finishes. The usual kind, and what a number alone means. |
SS start-to-start | The task starts when the other starts. |
FF finish-to-finish | The task finishes when the other finishes. |
SF start-to-finish | The task finishes when the other starts. |
A lag waits (+2d), a lead overlaps (-1d), and a percentage is a share of the first task's duration (+50%).
From the menu
Select the tasks in order and choose Edit › Link Tasks (⌘F2 / Ctrl+F2): each is linked finish-to-start to the next. Unlink Tasks (⌘⇧F2) takes the links between them off.
On the Gantt chart
Press on a bar and drag up or down onto another task's bar: a rubber band follows the mouse, and letting go links the two. Dragging the small handle after a bar always links. Which ends you start and finish on picks the kind: from a bar's start edge gives start-to-…, ending on the target's finish gives …-to-finish.
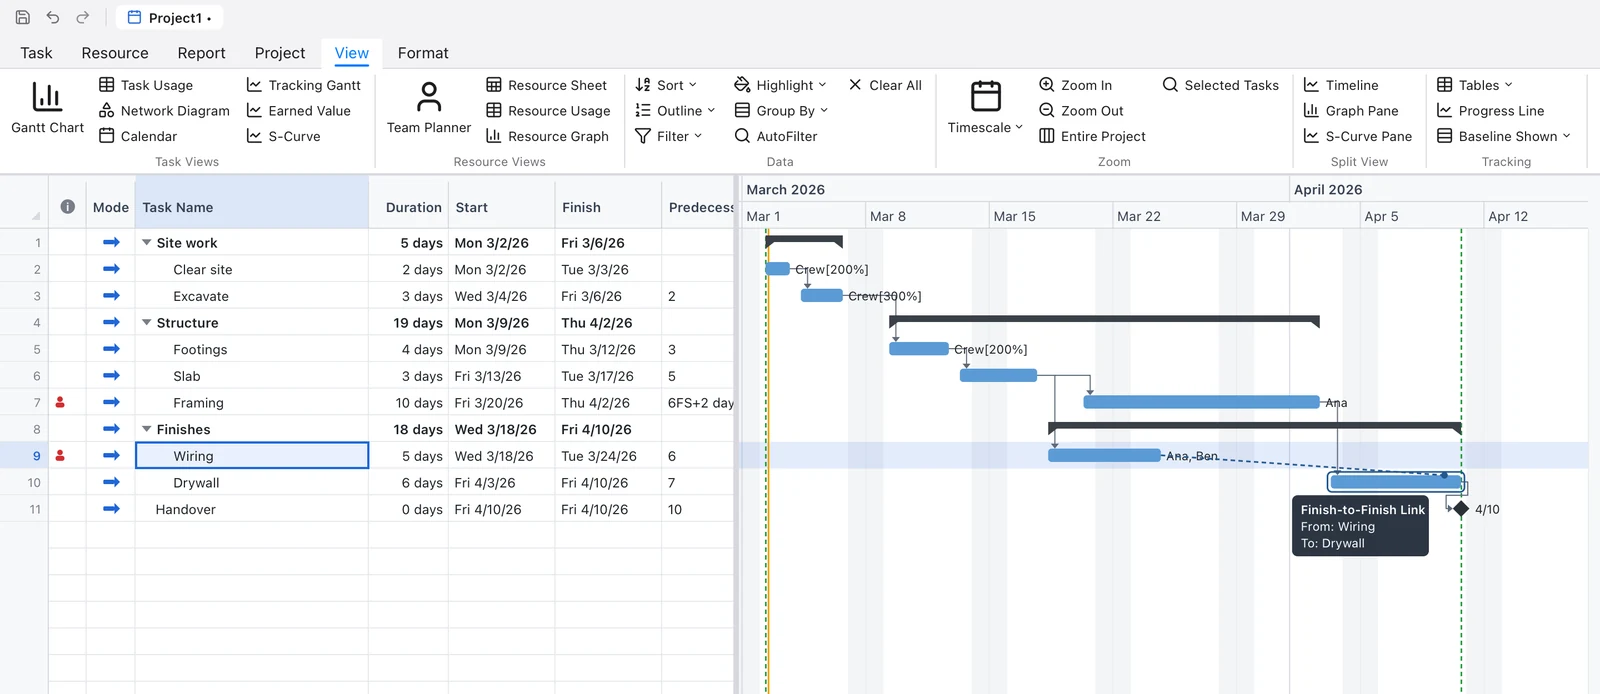
Dragging a bar sideways moves it: it gets a new start, kept with a Start No Earlier Than constraint. Dragging its right end changes its duration, and dragging the end of its progress changes its % complete. While you drag, a ghost bar and a small box show the new dates. Every change can be undone with ⌘Z.
To change a link, double-click its line on the chart for Task Dependency….
6. Or type the whole plan
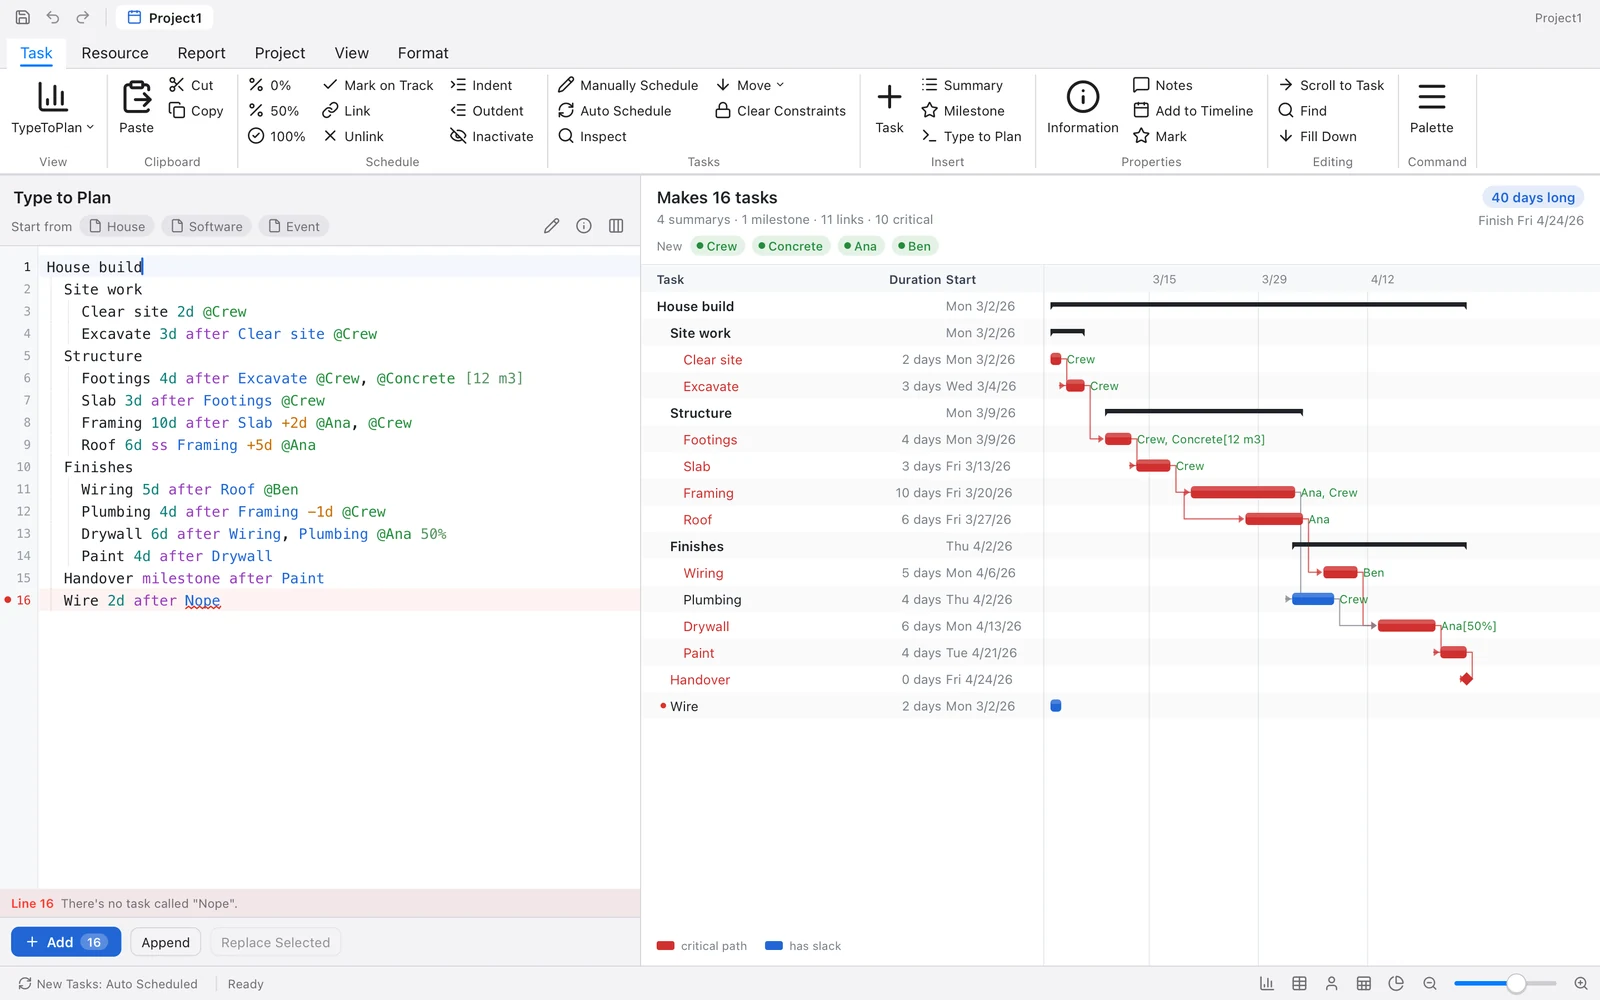
Steps 2 to 5 can be done in one go. Choose View › Type to Plan (⌘⇧O / Ctrl+Shift+O) and type the plan as an indented outline:
Kitchen renovation
  Plan
    Measure the room 1d @Sam
    Draw the design 3d after Measure the room @Sam
  Build
    Remove old units 2d after Draw the design @Crew
    Rewire 3d after Remove old units @Ben
    Fit cabinets 1w after Rewire @Crew
    Tile the walls 2d ss Fit cabinets +2d @Crew 50%
  Kitchen ready milestone after Fit cabinets, Tile the walls
As you type, the panel reads each line, underlines mistakes in red, and previews the tasks it will make, scheduled with the rest of the plan. Tab and ⇧Tab indent lines, and Enter keeps the indentation. Press Add (or Insert when a task is selected), or ⌘Enter, to put it in as one step you can undo. Append adds it at the end, and Replace Selected puts it in place of the selected tasks.
Going the other way, Insert › Edit Selection as Text turns the selected tasks into an outline to edit; Update puts them back. The panel has three examples to start from (House, Software, Event).
7. See the critical path
Choose Format › Critical Tasks. The tasks that set the finish date turn red, with the links between them: delay any of them and the project finishes later. Here that's every task except Tile the walls: it finishes a day before Fit cabinets does, so it has a day of slack.
- Format › Slack draws each task's slack as a thin line after its bar.
- To see the numbers, add a column: Insert › Column… and pick Total Slack (or Free Slack, Early Start, Late Finish…).
- View › Filter shows only some tasks (critical ones, for example), and View › Highlight marks them without hiding the rest.
- Options for it are on Project Information › Options: Critical if slack ≤ and Calculate multiple critical paths.
Keystone schedules again after every change. Project › Calculate Project (F9) does it by hand.
8. Set working time
The project's calendar says when work can happen. Choose Tools › Change Working Time…:
- On the Exceptions tab, press Add and give a holiday its name and day (or days). Tasks step around it. An exception can also be a day worked that normally isn't, such as a Saturday.
- The Work Weeks tab has the default week, which sets the hours of each weekday, and other work weeks: different hours for a named stretch of days, a summer schedule for example.
- The month preview shades working, nonworking and exception days, and follows what you type. OK puts it all in as one step you can undo.
The dialog can set the project's calendar and the selected tasks' calendar too. Resources have calendars of their own, picked in the Resource Sheet's Base Calendar column.
9. Add people and assign them
Choose View › Resource Sheet and type a resource on each row: Sam, Ben and Crew. The Type column says what each one is:
- Work: people and equipment, paid by the hour.
- Material: things used up, counted in the Material Label unit (
m3,tiles). - Cost: a cost you type on each task, such as a permit fee.
Max Units says how much of a resource there is: 100% is one person full time, and 300% a crew of three.
Now go back to View › Gantt Chart and assign them. Either:
- type in a task's Resource Names cell, names parted by commas, each with units in square brackets if it isn't full time:
Crew[50%], Ben. A name that isn't in the project becomes a new resource; or - open Project › Assign Resources… (⌥F10 / Alt+F10). The window stays open beside the plan and follows the selection: tick resources, type their units, and press Assign. Remove and Replace are there too.
Assigning work turns duration into work: a 3-day task with one person full time is 24 hours. The Task Usage and Resource Usage views show that work day by day.
10. Fix overallocations
A resource given more work at once than it has units is overallocated: its name turns red in the Resource Sheet, and the Resource Graph shows the peaks above its limit.
- Tools › Next Overallocation selects the next task that causes one and scrolls to it.
- Tools › Level All delays tasks just enough that nobody is overbooked; Level Selection levels only the selected tasks. A sheet lists what moved and anything still overallocated, and why.
- Tools › Leveling Options… sets how: the order tasks give way in, whether to level only within slack, whether leveling may split tasks, and the rest.
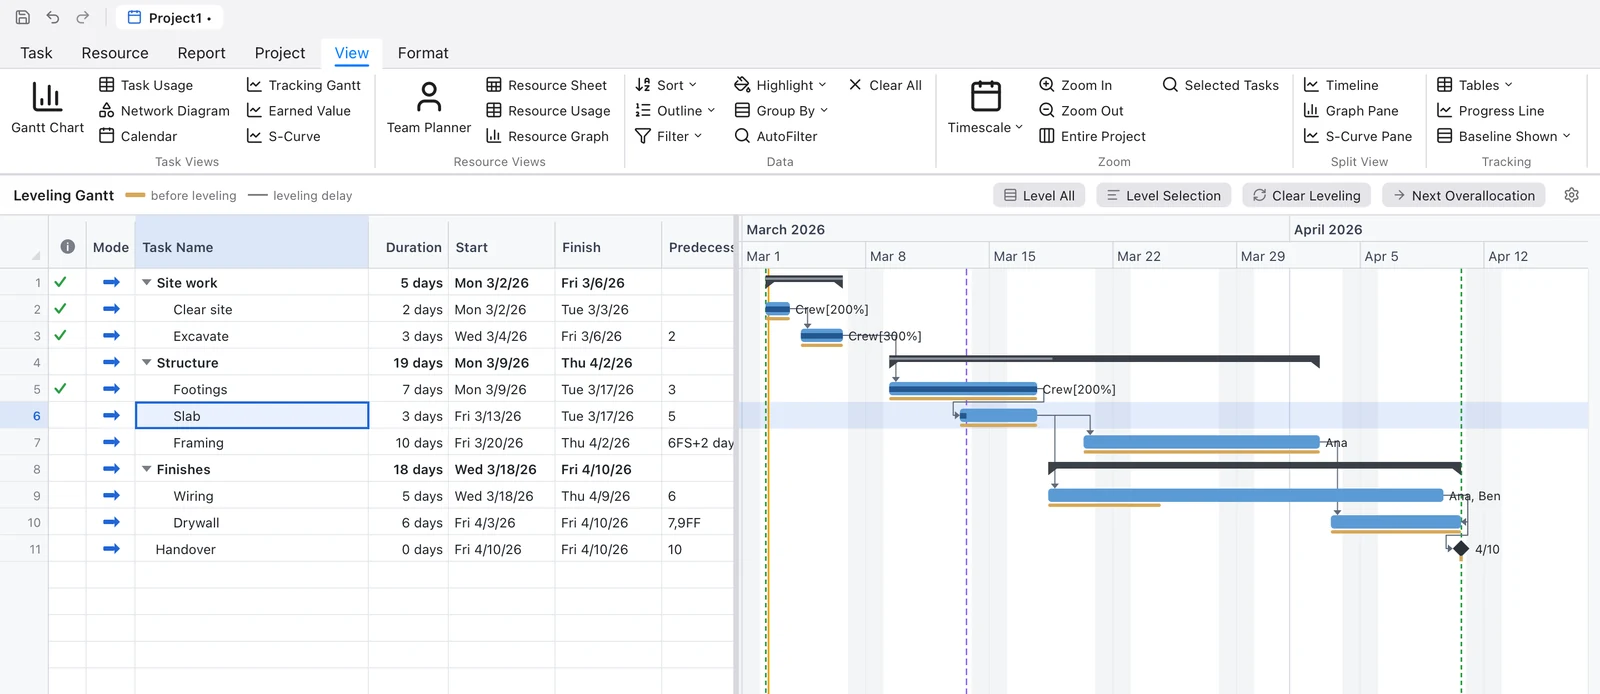
- View › Leveling Gantt draws each task's bar from before leveling under its bar, with the delay as a line. Tools › Clear Leveling takes the delays out again.
11. Add costs
- In the Resource Sheet, give work resources a Std Rate (
45/h) and, if they're paid more for overtime, an Ovt Rate. Cost/Use is charged once per assignment, a call-out fee for example. Material resources' rate is per unit used. - A task can carry a cost of its own in the Fixed Cost column, with Fixed Cost Accrual saying whether it falls at the start, at the end, or spread over the task.
- View › Tables › Cost switches the table to the cost columns: fixed cost, total, baseline, variance, actual and remaining. Tables › Entry brings the usual columns back.
The money format (symbol and decimal digits) is on Project Information › Options.
12. Set a baseline
When the plan is agreed, keep a copy of it to measure against. Choose Tools › Tracking › Set Baseline… and press OK. It saves every task's start, finish, duration, work and cost as Baseline. There are eleven baselines (Baseline, and Baseline1 to Baseline10) if you want to keep more than one, and each can be set for the whole project or only the selected tasks.
Format › Baseline draws the baseline under each bar, and View › Tables › Variance lists how far each task has moved from it.
13. Record progress
- Set the date you're reporting up to: Tools › Tracking › Status Date….
- Select a task and mark how far it is: Project › Tracking › 0% / 25% / 50% / 75% / 100% Complete, or drag the end of its progress on the bar. For more, Update Tasks… takes % complete, actual and remaining duration, and the actual start and finish.
- Mark on Track marks the selected tasks done as planned up to the status date. Update Project… does that for the whole project (or the selection) through a date you give, or reschedules unfinished work after it; Reschedule Unfinished Work moves what's left past the status date.
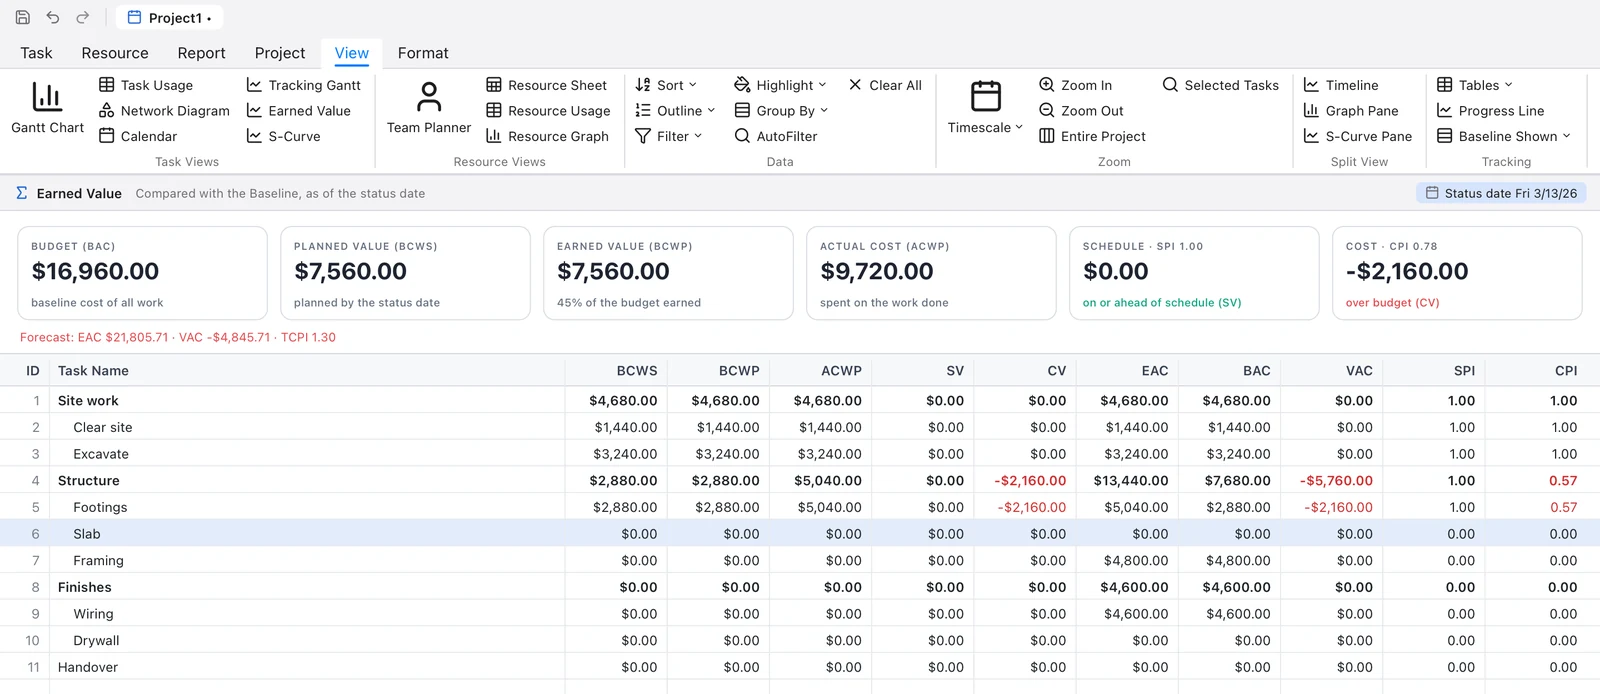
- See it: View › Tracking Gantt draws each bar over its baseline, and View › Progress Line joins how far each task has got. View › Earned Value has the earned-value table (planned value, earned value, actual cost, SV, CV, SPI, CPI and the estimates at completion).
14. Try a what-if
Suppose the cabinets might arrive a week late. Rather than change the plan and try to remember how it was, branch it:
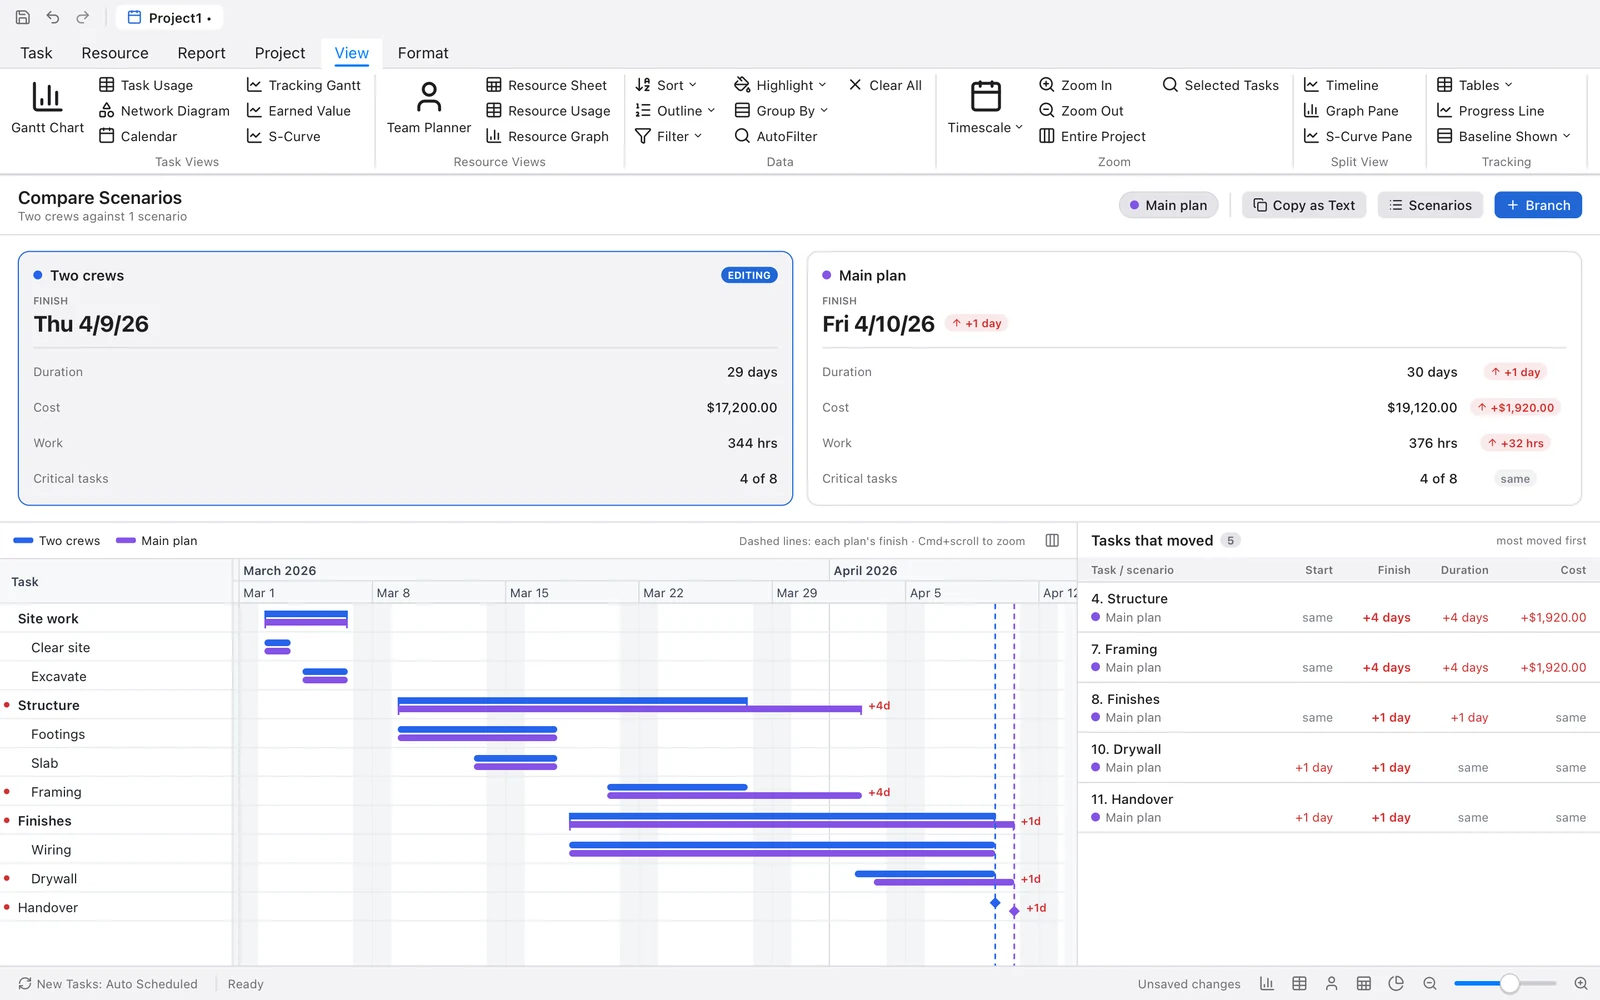
- Choose Project › Branch Plan… and name the branch, say Late cabinets. A copy of the plan is kept as a scenario, and you go on editing.
- Change what you like: make Fit cabinets
2w, move tasks, reassign people. - Choose Project › Compare Scenarios. Cards at the top compare the finish dates, work and costs; the Gantt chart has a thin bar per plan in each row; and the tasks that moved are listed. Up to three scenarios can be compared with the plan you're editing.
- The Scenarios side panel (View › Scenarios Panel) switches between plans, renames, duplicates and deletes them. Project › Switch to Scenario does the switching from the menu.
For one quick question there's Project › What If: This Task Took Longer…, This Resource Left… and This Task Started On…. The answer comes at once from a temporary branch, with Keep Change, Save as Scenario and Discard.
15. Save and share
File › Save (⌘S) saves a .keystone file: everything, scenarios and baselines included. Save As… is ⌘⇧S.
To send the plan to someone with other software, use File › Export: Microsoft Project XML, Primavera P6 XER, the table as CSV or an Excel workbook, or a PDF or picture of the chart. See Files, printing and pictures.
That's the whole cycle: plan, link, resource, cost, baseline, track, and ask what if. The rest of this page is the reference.
Part 2 · Reference
The views
Every view is on the View menu and the View tab of the ribbon. All of them share one selection: select a task in the network and it's selected in the Gantt chart.
- Gantt Chart
- The table and the bars. Zoom with View › Zoom In and Zoom Out (⌘=, ⌘-), Entire Project (⌘⇧F) or a View › Timescale level; Scroll to Task (⌘⇧T) brings the selected bar into view. Format has the bar and text styles, gridlines, the timescale, the layout and the columns.
- Tracking Gantt
- Each bar drawn over its baseline, with its progress.
- Network Diagram
-
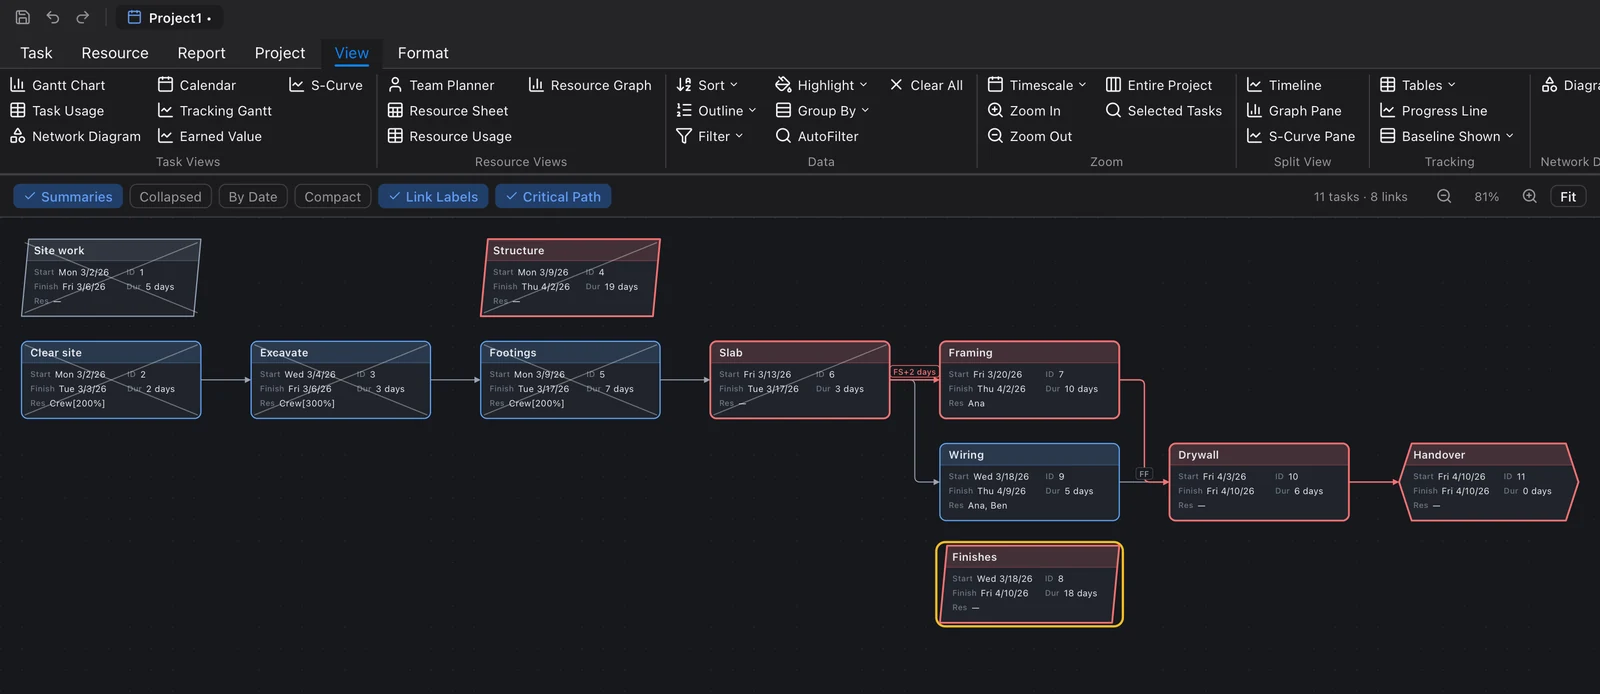
A box per task, in columns by link order (or Network: By Date), with the links between them. Choose the boxes: Full Cards, Compact Cards or CPM Cards, the textbook card with ES, EF, LS and LF in working days from the project start (or CPM Dates for dates) and the slack above it. Network: Start and End Nodes adds a node for the project's start and finish (on by default for CPM cards); Critical Path in Red and Link Labels do what they say. Dragging from one box onto another links them finish-to-start. The wheel scrolls, ⌘ + wheel or a pinch zooms, and Network: Fit shows it all. File › Export Network Diagram as PDF… or as Picture… saves it.
- WBS Chart
-
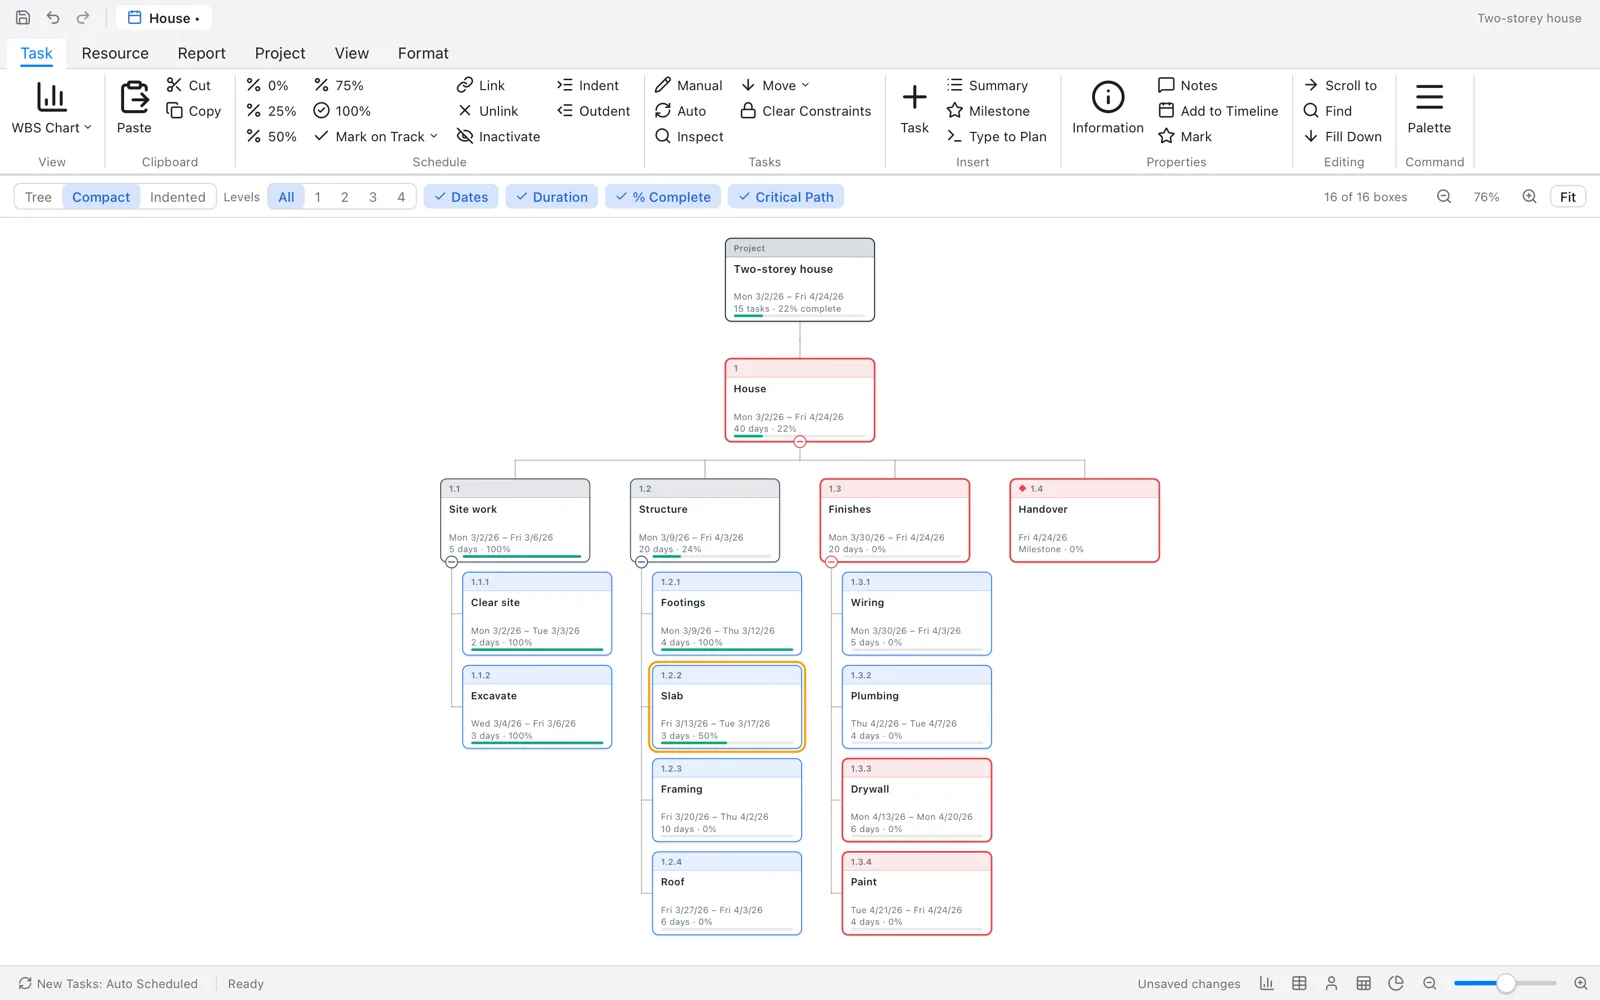
The outline as a work breakdown structure: the project at the top, each summary over its tasks, every box with its WBS code, its name, its dates, duration and % complete, and a progress bar. Choose the layout in the strip above it: Tree (children side by side), Compact (tasks stacked under their summary, the usual WBS chart) or Indented (one box a row, as an outline). Levels shows only so many levels under the project. The round button under a box folds what's under it, or opens it again (- and + do the same for the selected box). Dates, Duration, % Complete and Critical Path choose what the boxes show. Click a box to select its task, double-click it for Task Information (the project's box opens Project Information); the arrow keys go up to the summary, down to the first task under it, and across to its neighbours. File › Export WBS Chart as PDF… or as Picture… saves the whole chart.
- Calendar
- The tasks on a month or a week (Calendar: Month, Calendar: Week), with or without the summary tasks.
- Task Usage and Resource Usage
- The work of each assignment, day by day, under its task or its resource. (The cells show work; it isn't typed there yet.)
- Resource Sheet
- The resources as a table: type, label, initials, group, max units, rates, cost per use, accrual and base calendar.
- Resource Tree
-
The resources by their Group, as a tree under the project. A slash in the group makes levels:
Trades/Electricalputs the resource under Electrical, under Trades. Each box has the resource's kind and max units, its work and cost (Totals), and is red when overallocated (Overallocated); a group's box adds up the resources under it. Resources read from a P6 file come in with the parent resources above them as their group. It has the same layouts, levels and folding as the WBS Chart; double-click a resource for Resource Information.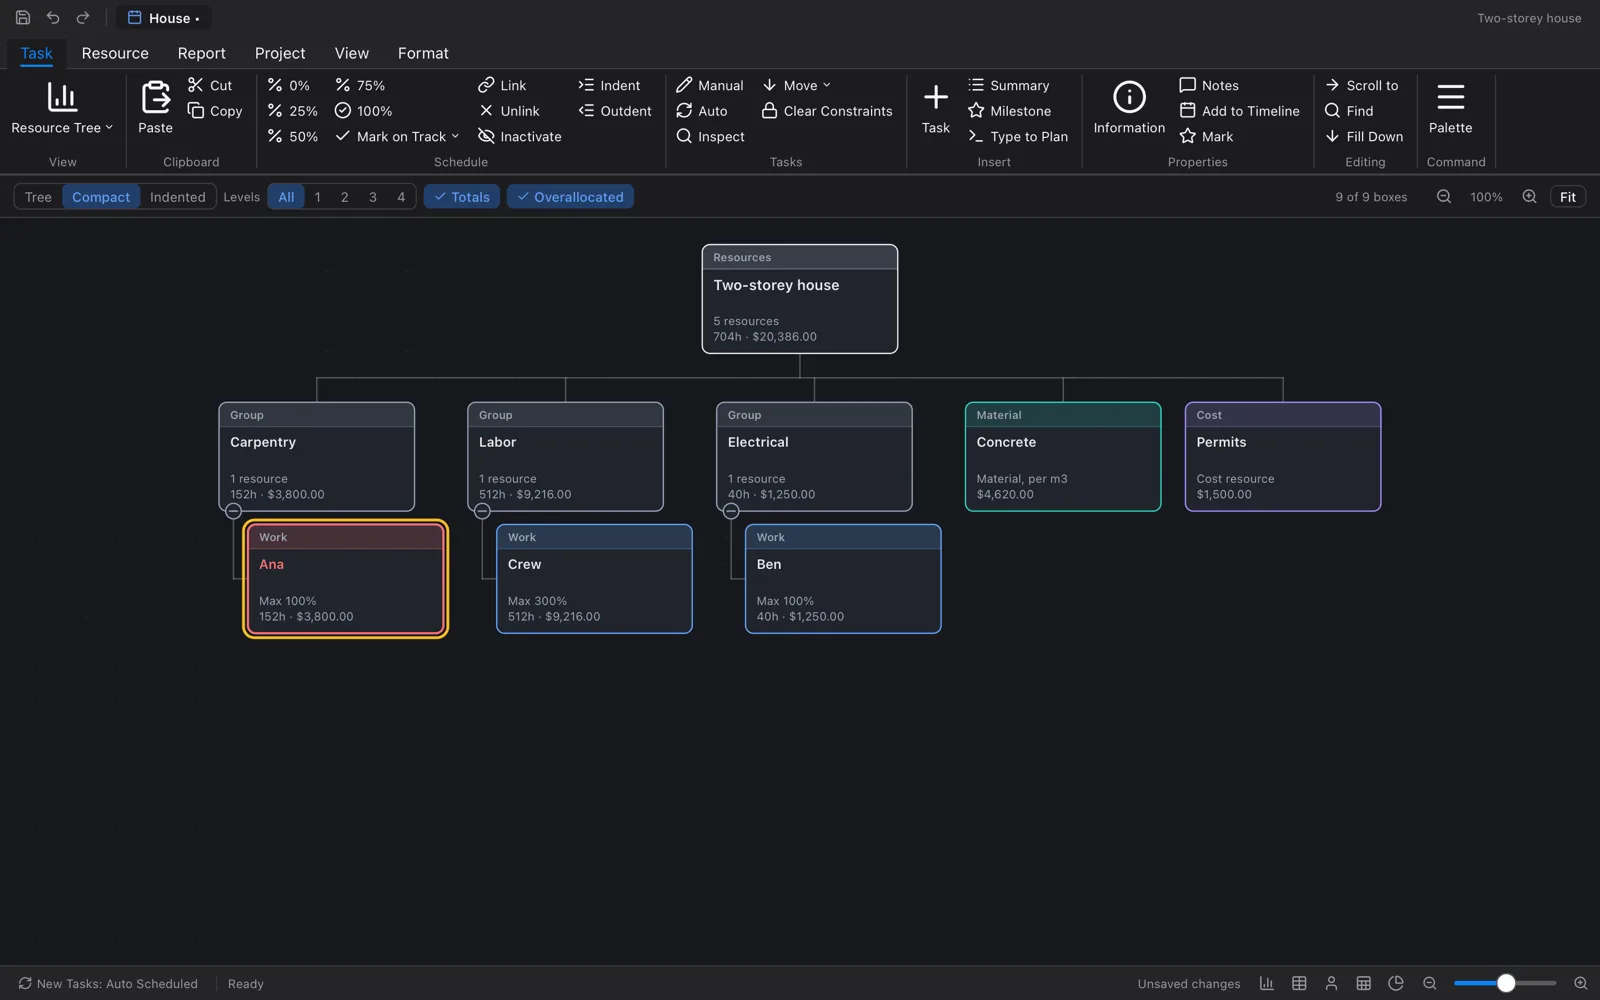
- Resource Graph
- One resource's load over time against its limit, overallocations in red. View › Resource Graph Pane shows it under the Gantt chart.
- Team Planner
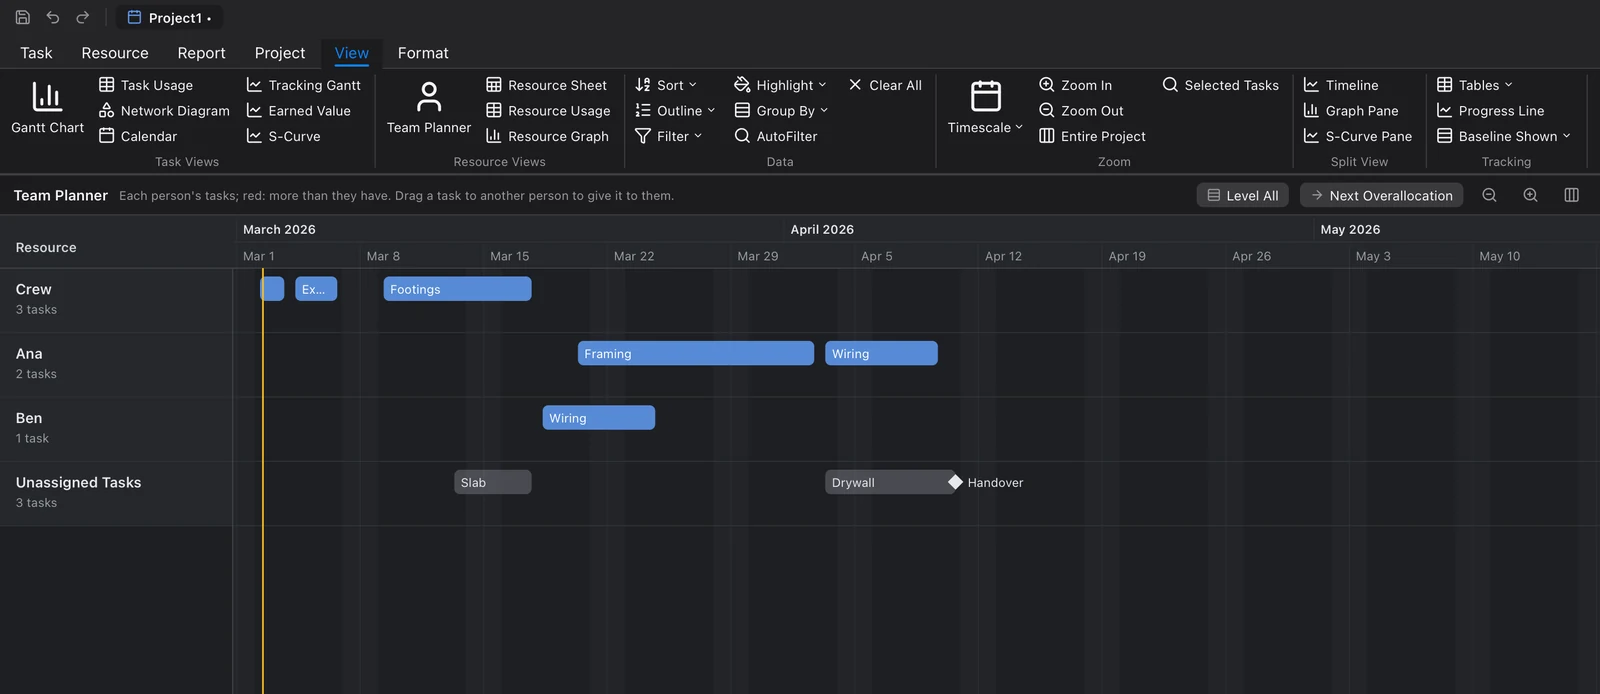
- A band for each person with their tasks as bars, overallocated stretches shaded red, and the tasks nobody works on at the bottom. (Dragging bars between people isn't done.)
- Timeline
- View › Timeline docks a strip above the view with the tasks you add to it (right-click a task › Add to Timeline), as bars or callouts, and the milestones. Drag its window to scroll the chart, or its edges to zoom.
- S-Curve
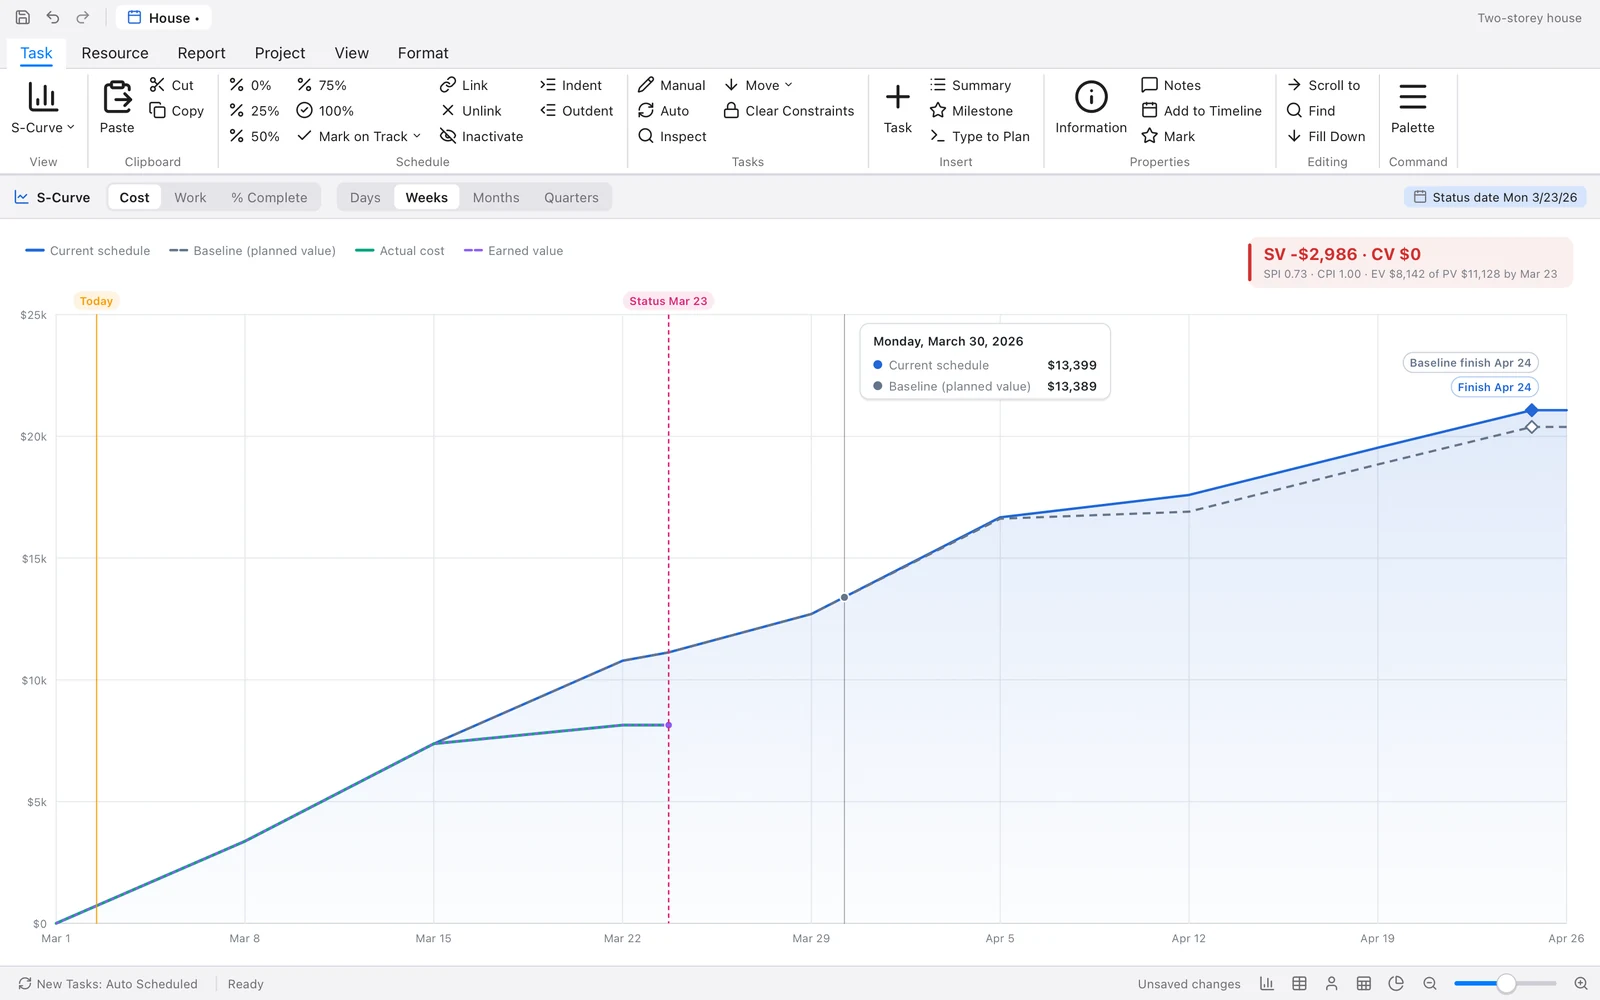
- Planned against actual, adding up over time: Cost, Work or % Complete (View › S-Curve Measure). It draws the plan as the baseline had it, as scheduled now, and what is done so far up to the status date, with the earned value. View › S-Curve Pane puts it under the Gantt chart, on the chart's timescale.
- Reports
- Project Overview, Cost Overview, Work Overview, Resource Overview, Critical Tasks, Late Tasks, Milestones and Earned Value Over Time (View › Reports). Each one exports with File › Export Report as PDF…; Export All Reports as PDF… makes one file of them all.
- Earned Value, Leveling Gantt and Compare Scenarios
- See steps 13, 10 and 14.
The task table can switch columns with View › Tables: Entry, Tracking, Variance, Cost, Work, Baseline and Earned Value. View › Group By, More Filters…, AutoFilter… and Sort By… arrange it; Clear Filter, Sort and Group puts it back. View › Task Inspector opens a side panel that explains why the selected task is where it is.
The command palette
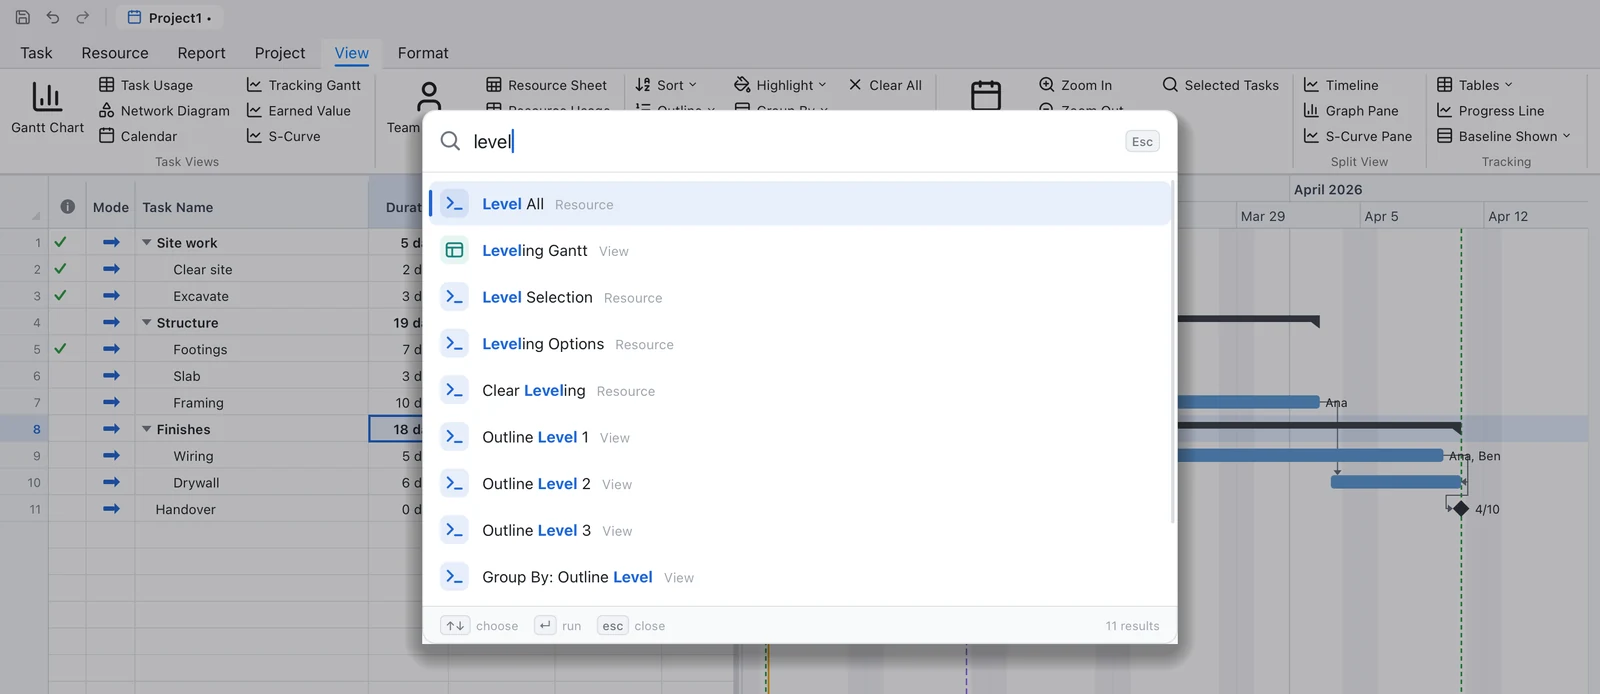
Press ⌘K (Ctrl+K) and type. The palette finds every command of the app, every view, and the project's tasks and resources; the commands you use most come first. Start with > for commands only, @ for resources, or # and a number for a row. ↑ and ↓ choose, Enter runs, Esc closes.
It also takes actions with values:
| Type | To |
|---|---|
zoom months | zoom the timescale |
filter critical | apply a filter |
set duration 5d | change the selected tasks |
link 3 to 7 | link two rows |
go to Framing, #12 | jump to a task by name or row |
@Ana | find a resource |
add Pour slab 3d after Formwork | add a task, written as in Type to Plan |
50% | set % complete |
Edit › Go to Task… (⌘J) opens it ready to find a task.
Keyboard shortcuts
Help › Keyboard Shortcuts lists them in the app too.
| Command | macOS | Windows |
|---|---|---|
| File and window | ||
| New Project | ⌘N | Ctrl+N |
| Open… | ⌘O | Ctrl+O |
| Save | ⌘S | Ctrl+S |
| Save As… | ⌘⇧S | Ctrl+Shift+S |
| Close Project | ⌘W | Ctrl+W |
| Print… | ⌘P | Ctrl+P |
| Next Project / Previous Project | ⌘` / ⌘⇧` | Ctrl+` / Ctrl+Shift+` |
| Editing | ||
| Undo / Redo | ⌘Z / ⌘⇧Z | Ctrl+Z / Ctrl+Shift+Z |
| Cut / Copy / Paste | ⌘X ⌘C ⌘V | Ctrl+X Ctrl+C Ctrl+V |
| Select All | ⌘A | Ctrl+A |
| Edit Cell | F2 | F2 |
| Fill Down | ⌘D | Ctrl+D |
| Delete | Delete | Delete |
| Find… / Find Next | ⌘F / ⌘G | Ctrl+F / Ctrl+G |
| Go to Task… | ⌘J | Ctrl+J |
| Tasks | ||
| Insert Task | Insert (on keyboards that have it) | Insert |
| Task Information… | ⇧F2 | Shift+F2 |
| Indent / Outdent | ⌥⇧→ / ⌥⇧← | Alt+Shift+Right / Left |
| Move Task Up / Down | ⌥⇧↑ / ⌥⇧↓ | Alt+Shift+Up / Down |
| Link Tasks / Unlink Tasks | ⌘F2 / ⌘⇧F2 | Ctrl+F2 / Ctrl+Shift+F2 |
| Assign Resources… | ⌥F10 | Alt+F10 |
| Type to Plan | ⌘⇧O | Ctrl+Shift+O |
| Calculate Project | F9 | F9 |
| View | ||
| Command Palette… | ⌘K | Ctrl+K |
| Zoom In / Zoom Out | ⌘= / ⌘- | Ctrl+= / Ctrl+- |
| Zoom Entire Project | ⌘⇧F | Ctrl+Shift+F |
| Scroll to Task | ⌘⇧T | Ctrl+Shift+T |
| In the table and in Type to Plan | ||
| Indent / outdent the task or line | Tab / ⇧Tab | Tab / Shift+Tab |
| Put the outline in (Type to Plan) | ⌘Enter | Ctrl+Enter |
Function keys on a Mac laptop may need fn held down, depending on the keyboard setting.
What you can type
Durations and lags
A number, then a unit, then perhaps ? for an estimate. Spaces are optional, and a number with no unit is in days.
| Unit | Write | Working time |
|---|---|---|
| Minutes | m min mins minute | as typed |
| Hours | h hr hrs hour | as typed |
| Days | d dy day days | Hours per day (8) |
| Weeks | w wk wks week | Hours per week (40) |
| Months | mo mon month | Days per month (20) |
Put e in front for elapsed time, which runs through nights and weekends: 3ed is three calendar days, 2ew two calendar weeks (a curing slab, a delivery). Examples: 5, 5d, 5 days, 2.5 wks, 4h?, 3ed. A duration of 0 makes a milestone. Lags take the same units, with a sign (+2d, -1d), or a percentage (+50%).
Predecessors
Row numbers parted by commas, each perhaps with a link kind (FS, SS, FF, SF) and a lag: 3, 3FS, 3SS+2d, 12FF-1 day, 4SF+50%, or several: 3,5FS+2 days,7SS.
Resource Names
Names parted by commas (or semicolons), each perhaps with units in square brackets: Ana, Crew[50%], Ana, Ben[200%]. Units can be written 50%, 50 or 0.5.
Type to Plan lines
One task per line; indentation (tabs, or steps of two or four spaces) sets the outline. Bullets (-, *, •) and numbers (1., 1.2) in front are ignored. A line with no duration and lines under it is a summary.
Name [duration] [after A, B | ss A +2d | ff A -1d | sf A] [@Res, @Res 50%] [by date | on date | from date] [milestone | !]
| Write | Means |
|---|---|
after Footings or fs Footings | finish-to-start link from the task named Footings. Several: after Wiring, Plumbing |
ss Framing +5d, ff Beta -1d, sf … | the other link kinds, with a lag or lead after the name |
after #3 | a link from row 3 of the project |
"Sign off on plans" | a name in quotes, when it holds words like on or after |
@Ana, @Crew 50%, @Crew 2 | resources, with units (2 is two people). New names become new resources |
@Concrete [12 m3] | a material and the amount used |
@Venue $12000 | a cost resource and the amount |
by 2026-12-01 | a deadline |
on … / from … | must start on / start no earlier than. snet, snlt, fnet, fnlt, mso, mfo and alap work too |
milestone or ! | a milestone |
A name is looked for among the lines above (nearest first), then below, then among the project's tasks. Mistakes don't stop the reading: each is underlined and the rest goes in.
Files, printing and pictures
| To | Choose |
|---|---|
Open a Keystone file, a Microsoft Project file (.mpp or .xml) or Primavera P6 (.xer) | File › Open…, or drop the file on the window |
| Bring in tasks from a spreadsheet | File › Import › CSV File… or Excel Workbook… (its first sheet) |
| Save for Microsoft Project or P6 | File › Export › Microsoft Project XML… or Primavera P6 XER… |
| Save the table | File › Export › Table as CSV… or Excel Workbook… |
| Save the chart | File › Export › PDF… or Picture (PNG)…; Edit › Copy Picture puts it on the clipboard |
| File › Page Setup…, Print Preview, Print… (⌘P) |
Importing reads the header row by Microsoft Project's field names (Name, Duration, Start, Finish, Predecessors, Resource Names, Outline Level, WBS, % Complete, Notes, Cost, Work and the rest); any other column becomes a custom text field named after its header. The outline comes from an Outline Level column, or WBS or outline numbers, or names indented with spaces. Anything that can't be read is listed by row and column, and the rest goes in.
Microsoft Project's own .mpp files, from Project 2000 to Project 2024 and 365, open like any other: tasks, links, calendars, resources and their rates, assignments, baselines and custom fields come in, and what can't be kept is listed when the file opens. Keystone doesn't write .mpp: to hand a plan back to Microsoft Project, export it as Microsoft Project XML, which Project opens. Files saved by Project 98 and files with a password can't be opened; in Project, save them again without the password, or as XML.
Microsoft Project XML keeps one link between two tasks, so a P6 pair (SS and FF between the same two tasks) is exported as its first link. Keystone's files follow the published formats and read back in other tools, but haven't been tried in Microsoft Project or P6 themselves.
Crash recovery
While a project has unsaved changes, Keystone writes a copy of it every half minute into its data folder. Saving, closing the tab or quitting normally deletes the copy. If Keystone stops without quitting, the next time it starts it opens each copy in a tab of its own as an unsaved project and says so: save it to keep it.
Updates and privacy
Keystone looks for a new version as it starts and every few hours while it's open, downloads it in the background, checks it, and installs it when you quit. The Help menu has:
- Check for Updates…: look now, and say what was found.
- Check for Updates Automatically: off, and Keystone only looks when you ask.
- Install Updates Automatically: off, and a bar under the ribbon offers each update instead.
- Send Anonymous Usage Statistics: off, and nothing is counted.
Your projects never leave your computer. The privacy page lists exactly what is sent.
Something here doesn't match the app, or a step isn't clear? Write to admin@syncster.dev.